Did you know that studies have shown, that 80% of all people have ‘visual’ as either their primary or secondary preferred way of receiving information?
Sharing information in a visual way by illustrating processes and facts makes it more effortless for the receiver to comprehend and remember.
Educational material: Metabolism explainer
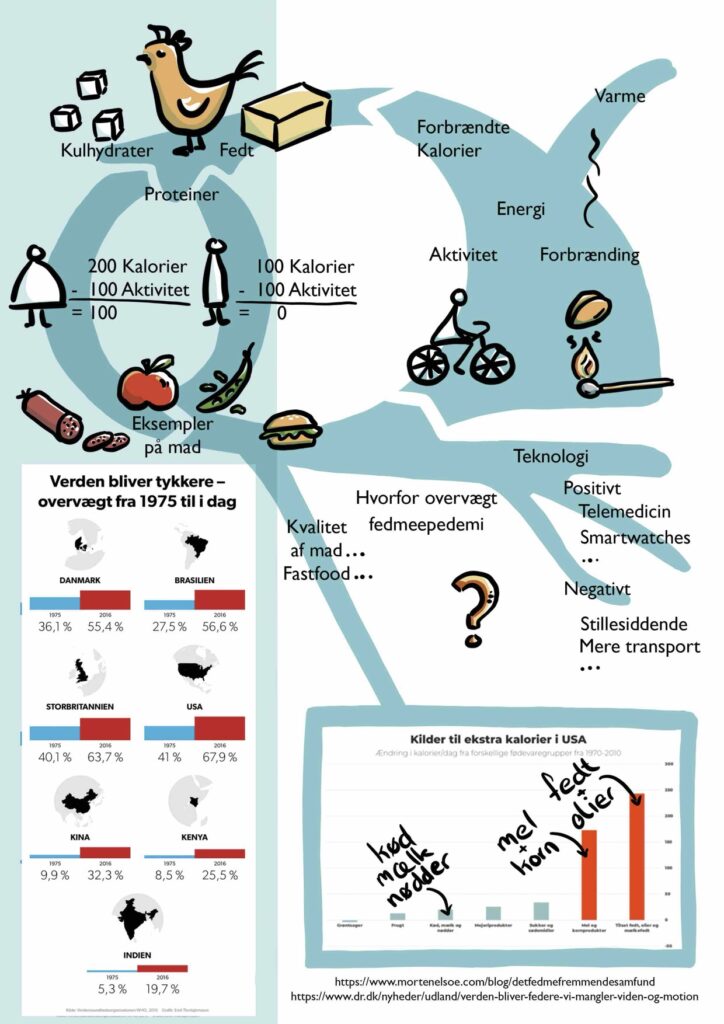
This example from educational material shows the process of energy consumption for humans.
Our body needs energy, illustrated by the tree main types: protein, carbohydrates, and fat.
How food is the source for energy. That activity and exercise burns energy – and also creates heat. This ties into a different topic for the pupil to digg into on another page about heat and energy transfer.
The style is kept in a few colours, simple drawing style to make it easier for the student to focus on the content as well as feeling able to produce something similar.
Some facts are also included on the page to support the topic bringing other angles into play.
By adding facts, in this case about food sources with a high amount of calories, for US, the student is nudged into thinking ‘what about other countries?’
Facts about the development of obesity from the year 1975 until today also animated the student to think about time, and longterm effect.
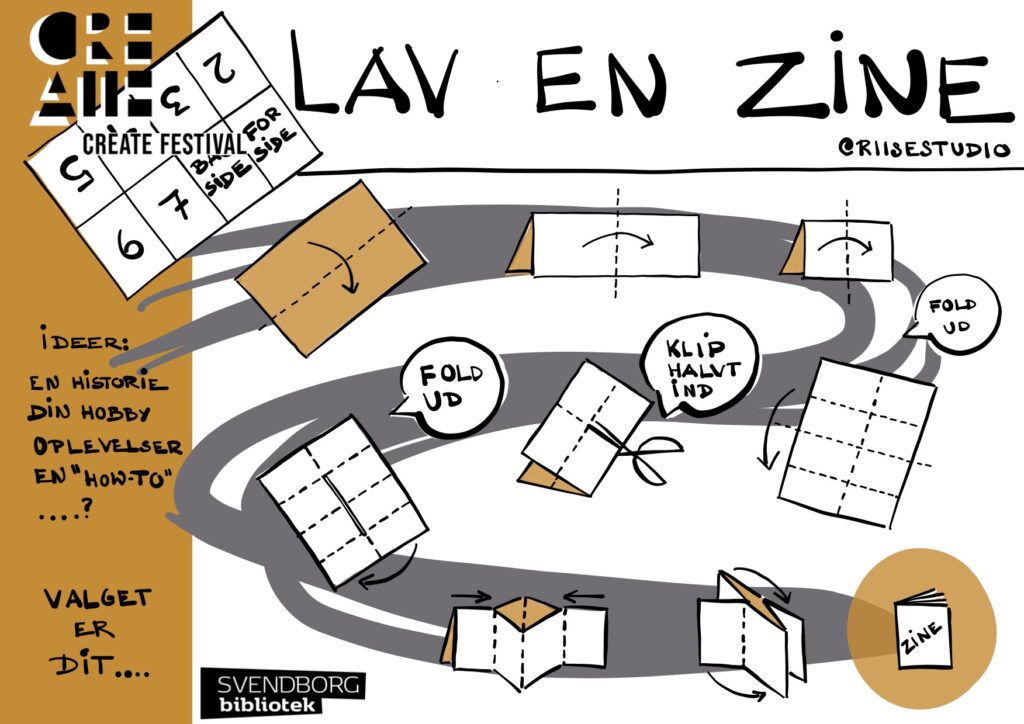
Guide: How to make a Zine
A step-by-step guide with as few word as possible, only visual process that explains how to make a zine. Accompanied by template and example – read the post here ‘How to make a Zine‘
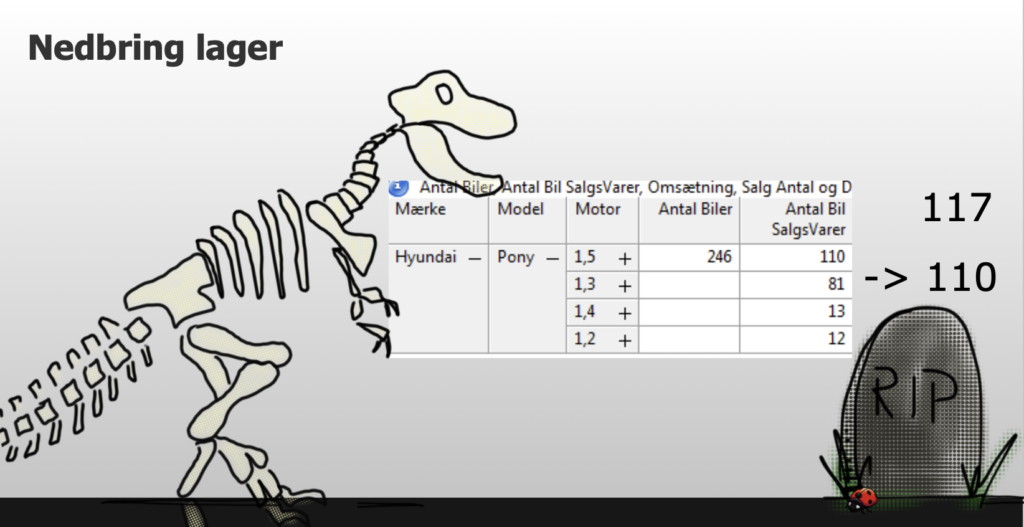
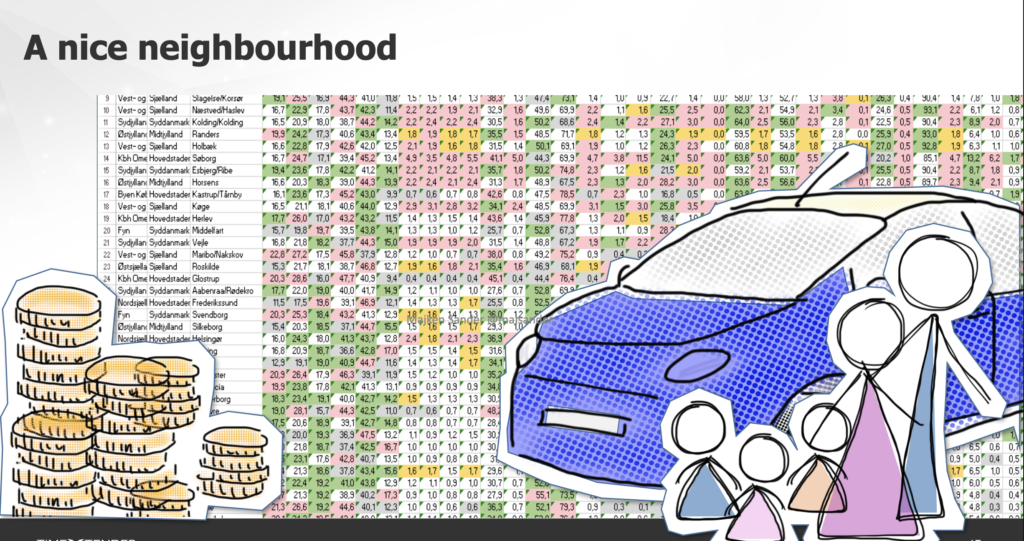
Illustrations to prove a point or tell a story
Building powerpoints, keynote presentations based on illustrations. Small vignettes that builds up the storytelling during your presentation.